Faraone Fractal Solutions · May 2026
FAIB
NEXUS
Market State Analyzer
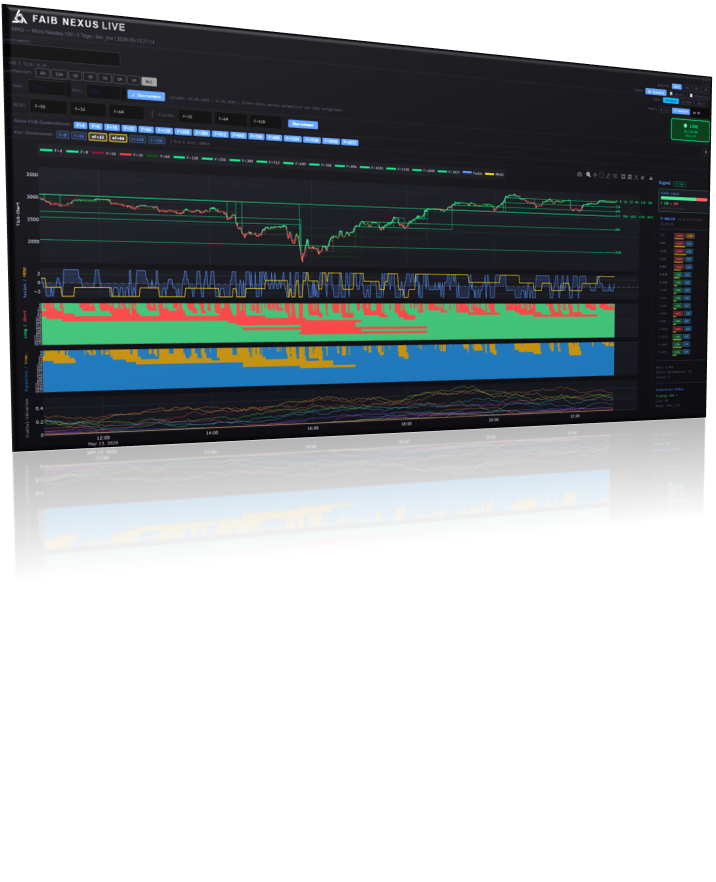
Fractal market structure — simultaneous, live, in real time. Updated tick by tick. No indicators. No predictions. States — not signals.
Fractal Intelligence
Faraone Fractal Solutions · May 2026
Market State Analyzer
Fractal market structure — simultaneous, live, in real time. Updated tick by tick. No indicators. No predictions. States — not signals.
Fractal Intelligence
The Problem
Analysts have access to more data than ever — but what is missing is a state description of the market as a system.
MultiTimeframe tools show 3–7 time levels. Signals, directions — but no simultaneous structural depth across all scales.
Phase transitions only become visible once the chart has already turned. The tension before it remains invisible.
What it is
Everything built fractally — each level emerges from the accumulation of tick movements. No time artefacts, no smoothing.
A framework that enables both structural depth and complete overview at a single glance — simultaneously.
Through patterns and colors the structure becomes readable without interpretation overhead. One glance is enough.
A pure state system — does not predict, does not signal trades. Allows market states to be observed as a whole.
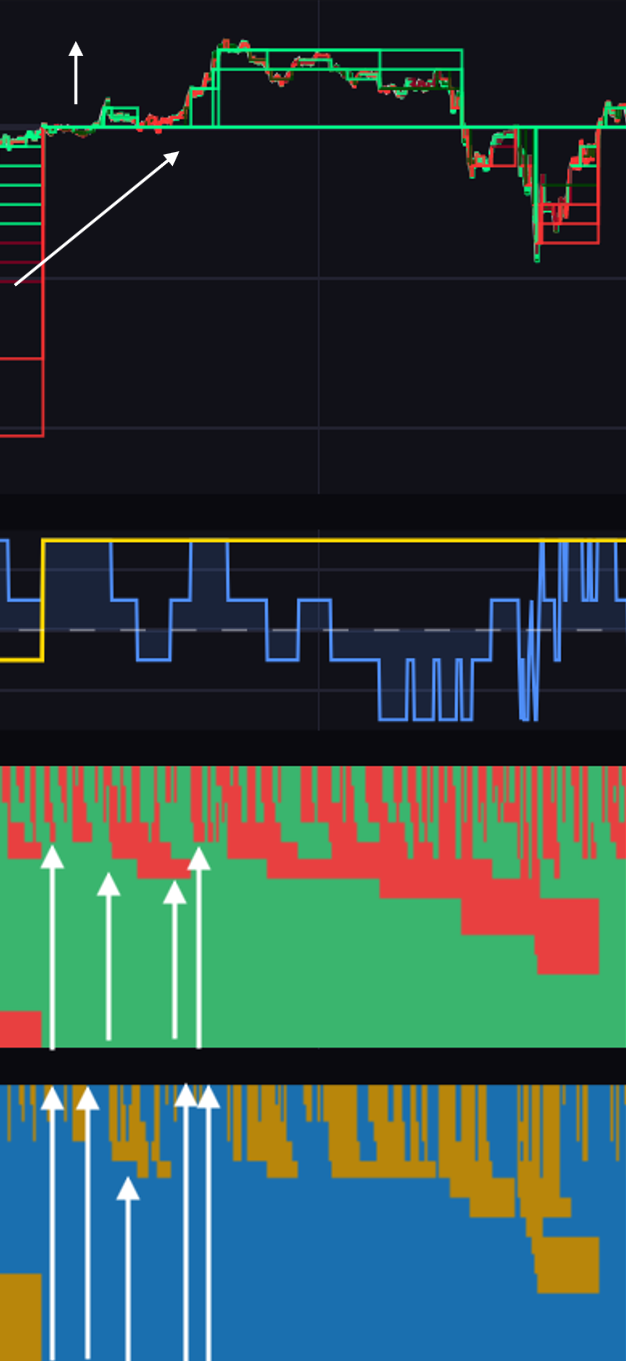
Core Concept
Direction and energy both point upward. The market acts as a coherent block — clear readable structure.
Direction still up, energy fading. The structure is weakening — caution is indicated before the next move.
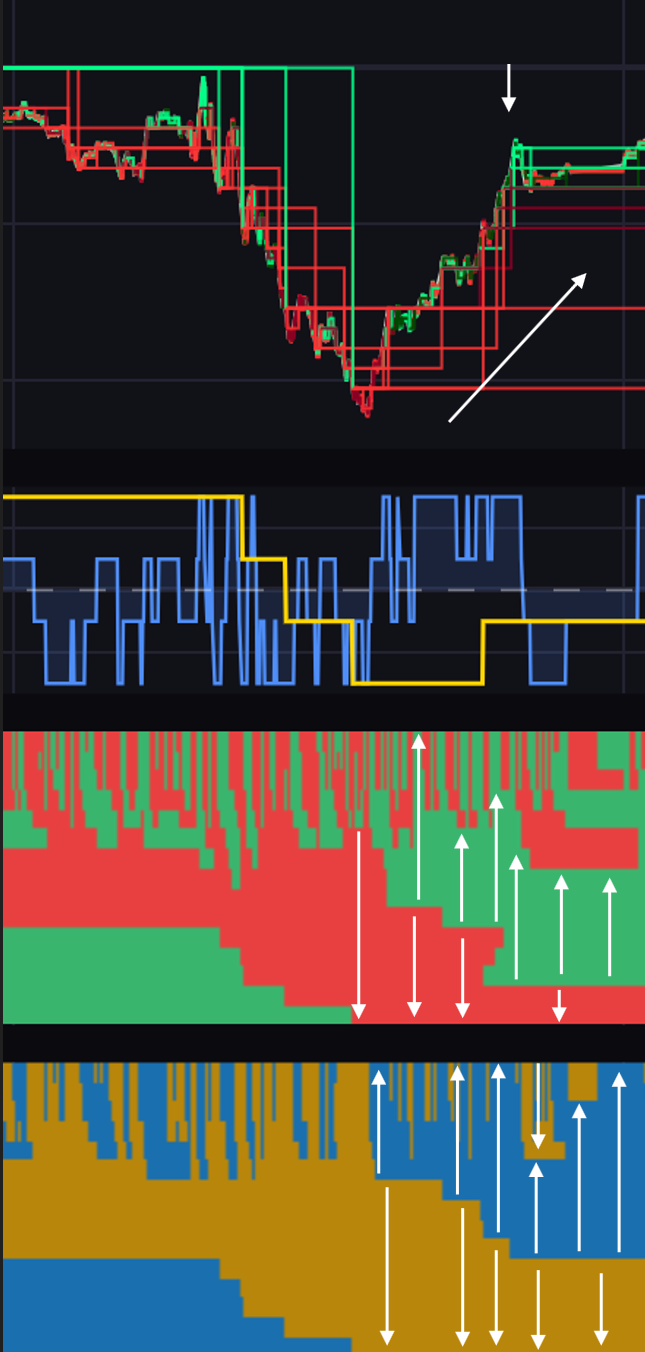
Direction and energy both point downward. The market is expanding its downward structure coherently.
Strong downtrend compressing — energy stored, possible structural release. The tension is visible before the price confirms.
Each of the 20 fractal levels is always simultaneously in one of these four states.
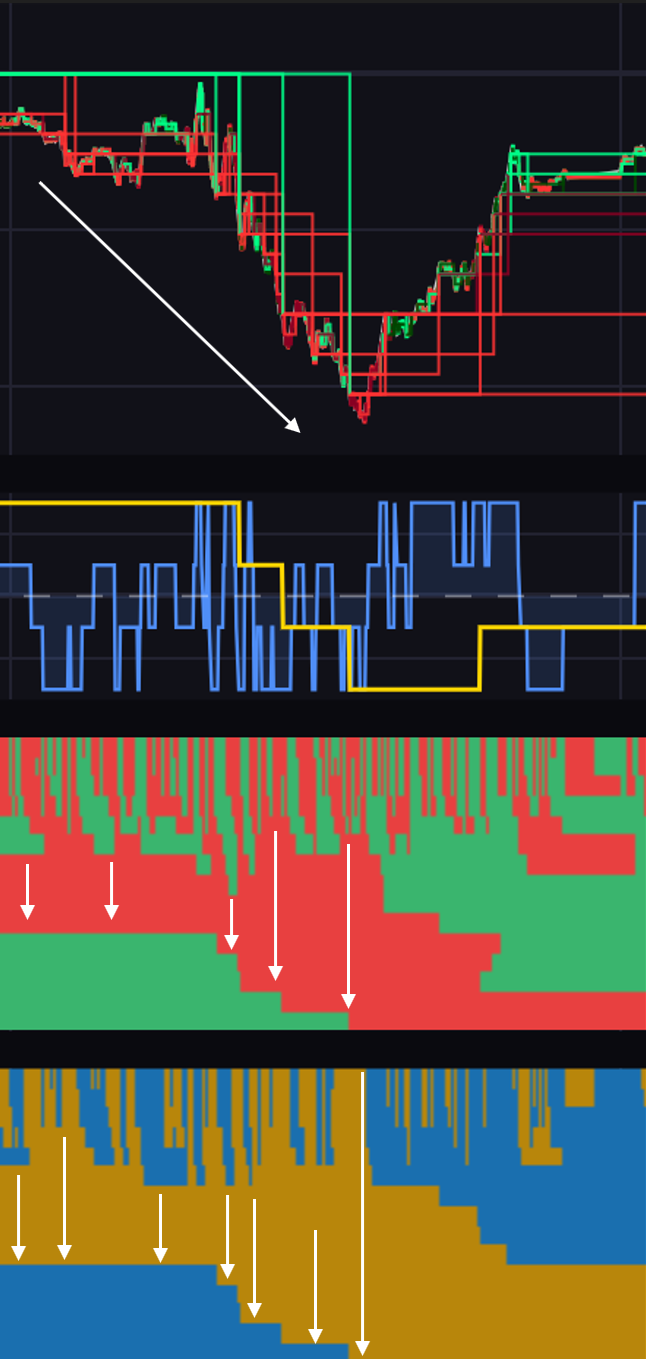
Structural Depth
Dominate and set the framework — the staircase lines in the chart. They define the structural context within which all smaller levels operate.
Move within the framework — probe the boundaries and respect them. Their behavior is constrained by the dominant structure above them.
When small levels intensely stress the master — phase transition intensity rises. A precursor to structural breaks, visible before the chart turns.
Dynamics are the key factor: small levels can overturn the dominant trend — BEFORE the chart confirms it. NEXUS shows this hierarchy live.
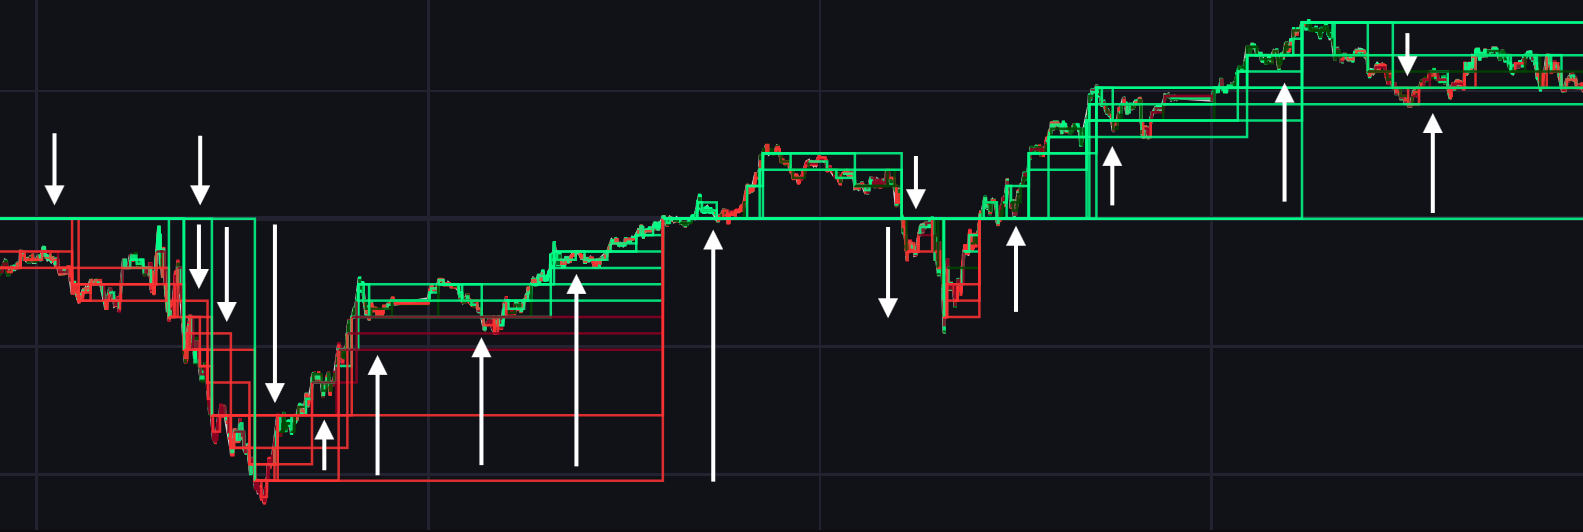
LARGE LEVELS: LONG → structural framework intact
SMALL LEVELS: SHORT → slaves stressing the master
→ NEXUS shows the conflict before the chart turns
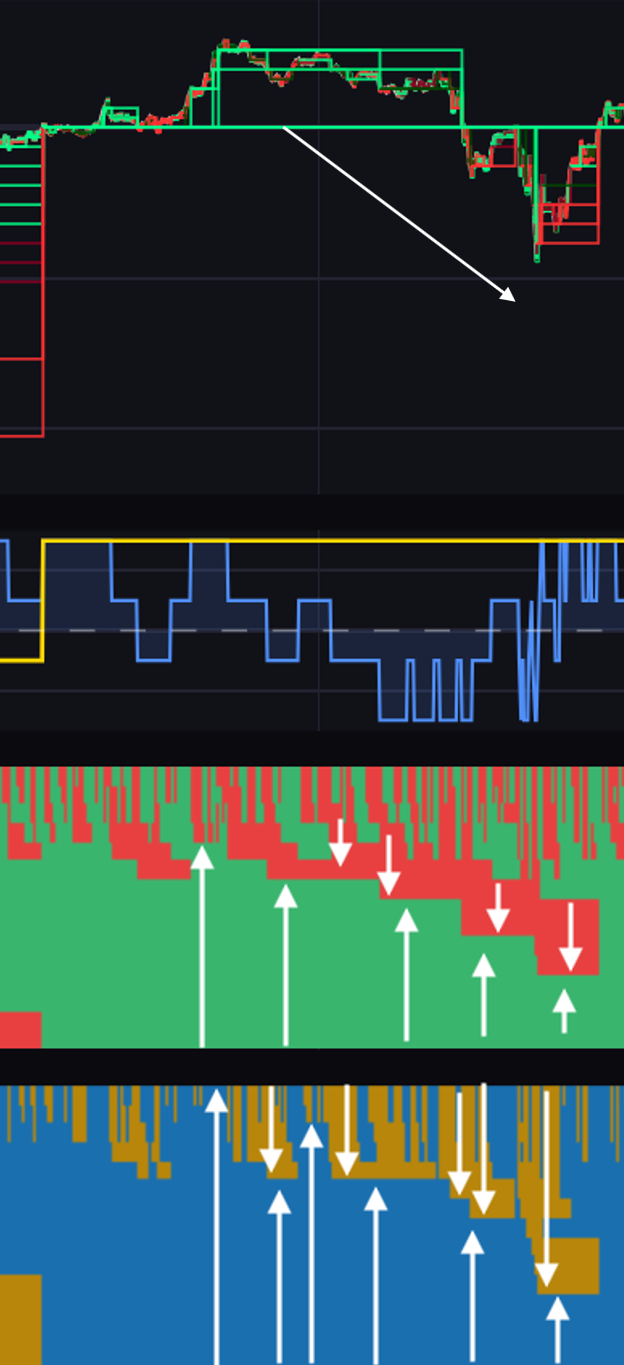
Structural Complexity
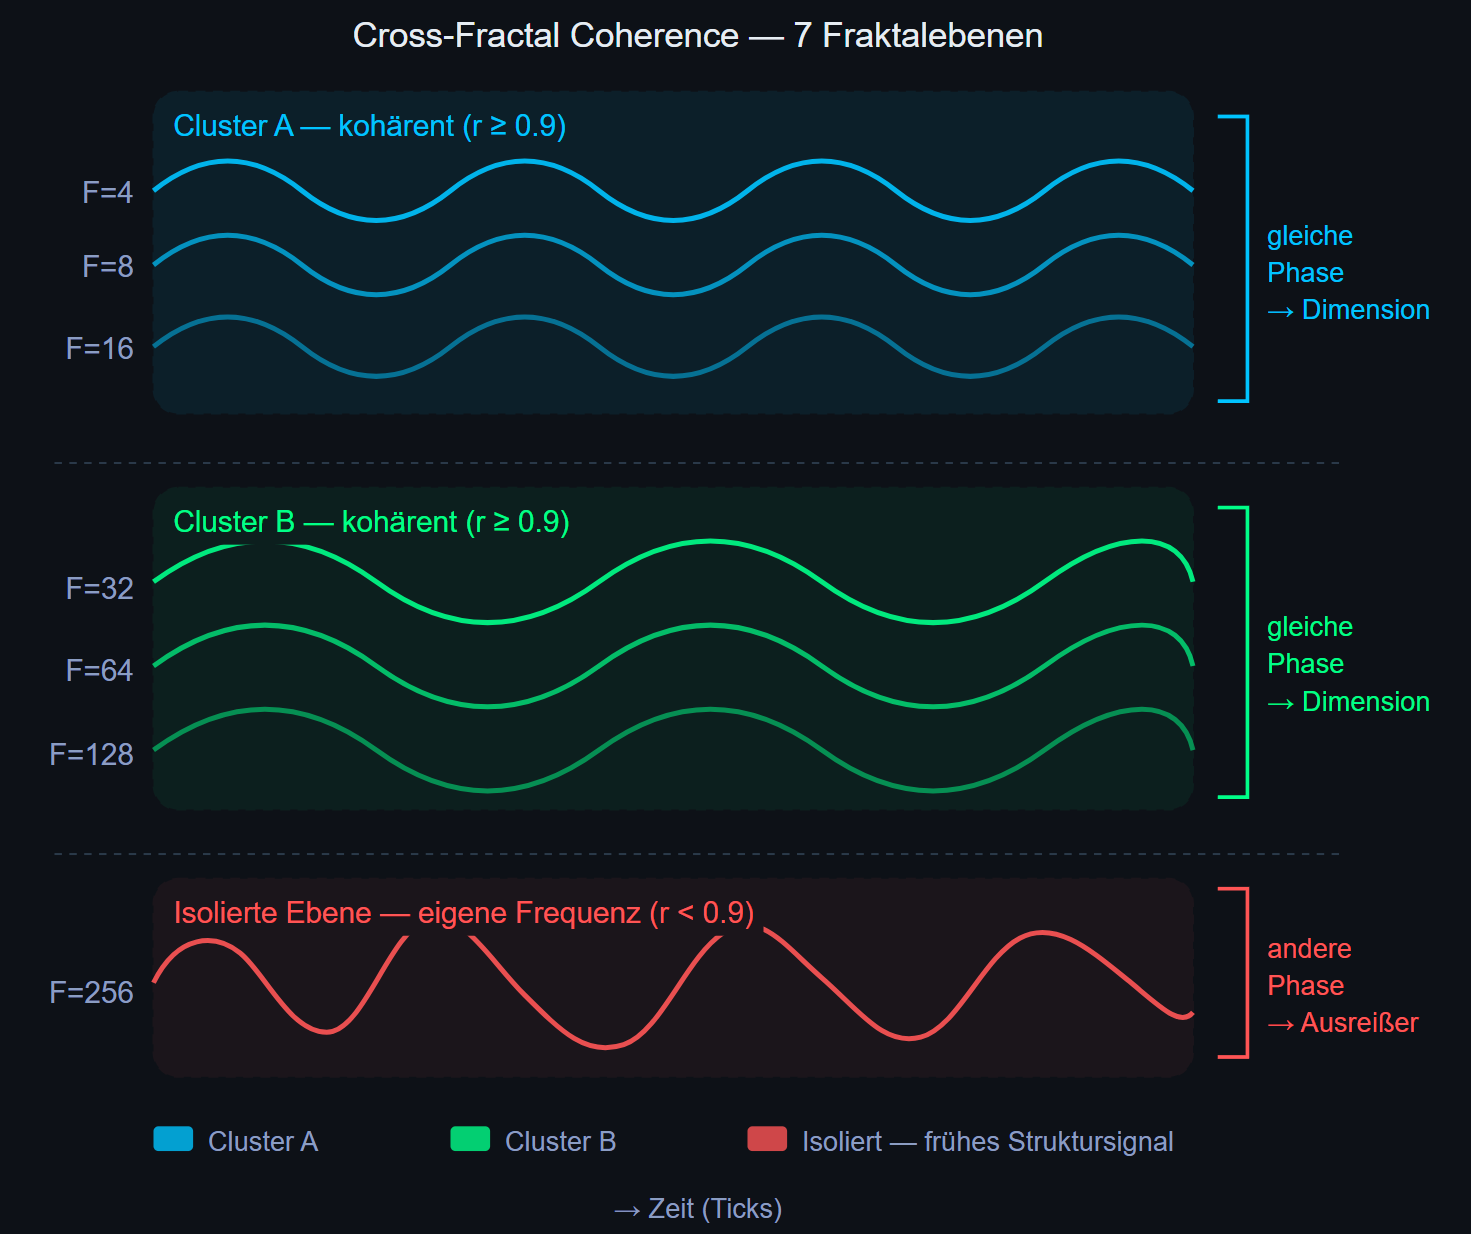
■ aligned ■ outlier (early signal) ■ isolated (structural tension)
Market Seismograph
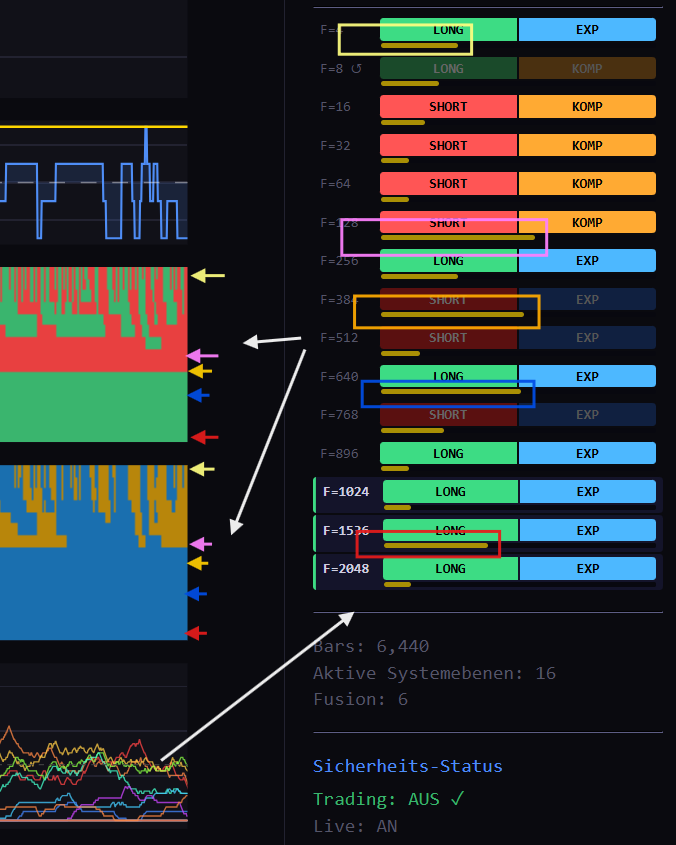
Large levels calm. Small levels at critical intensity. → Slaves are stressing the master. Structural tension building — phase transition possible.
What makes it unique
Conventional time charts show the market like a film you only see in individual scenes — 1 minute, 5 minutes, 1 hour. Snapshots. Gaps. Averaged truth.
FAIB NEXUS uses increments — tick by tick, without time basis. Every tick is a frame. Nothing is skipped. Nothing is averaged. This produces a more continuous picture of market movement — without fixed time grids, with less information reduction.
FAIB NEXUS uses an incremental approach — market noise is not filtered, but used as the basis for analysis.
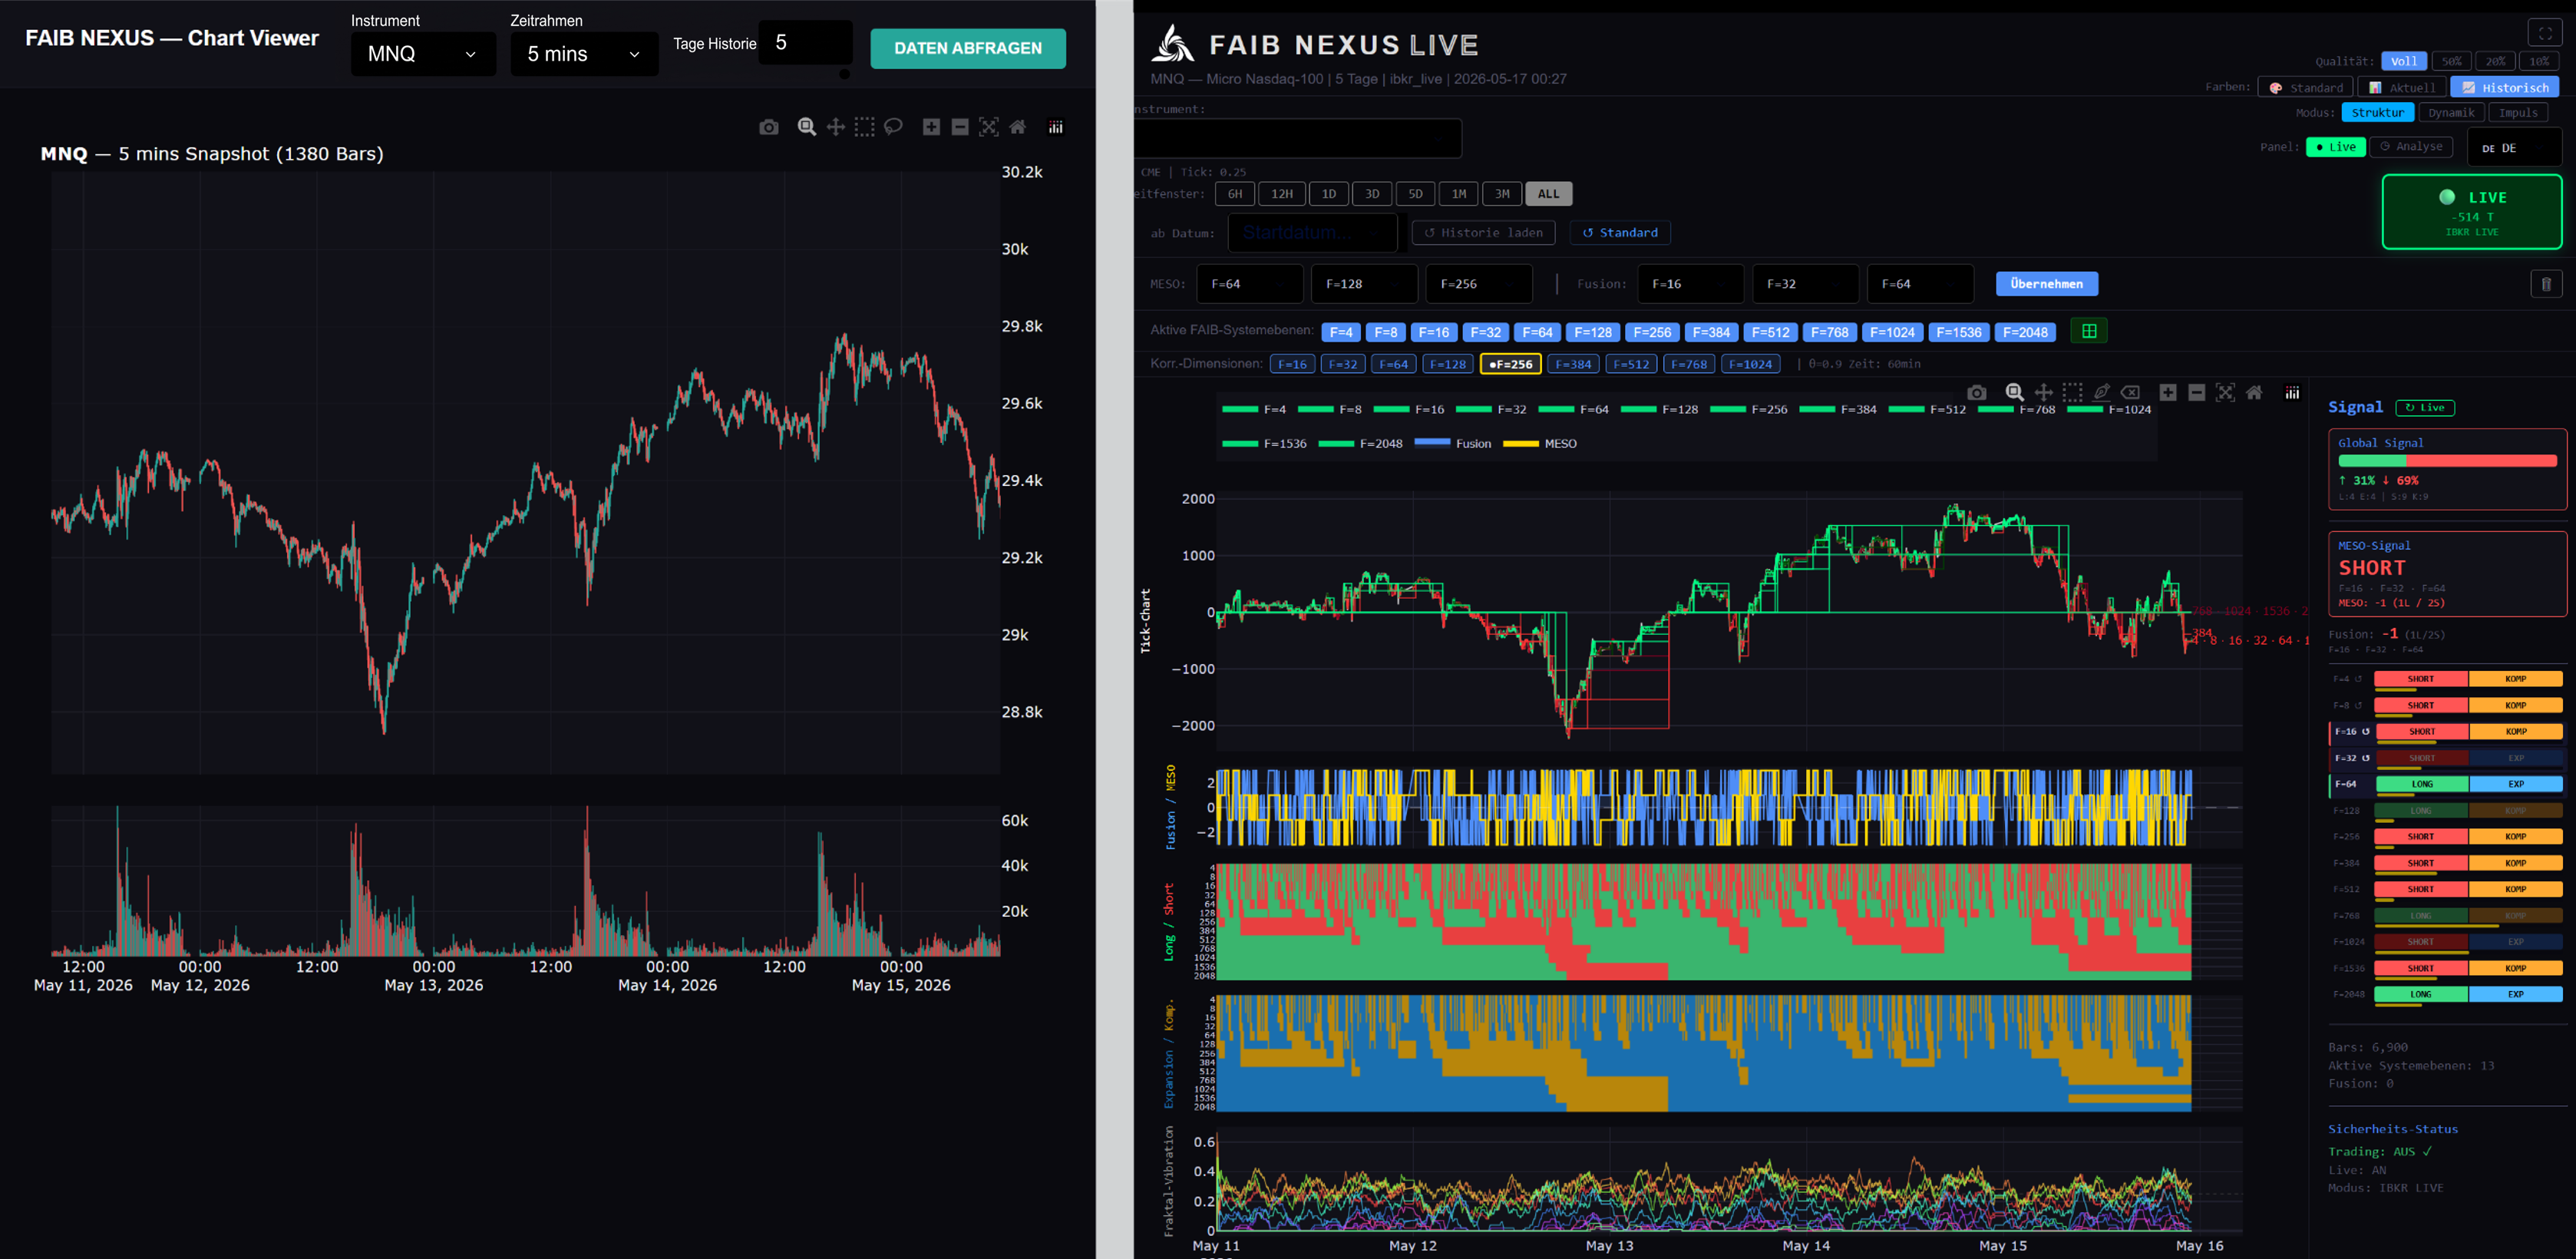
← What you know
What you haven't seen yet →
Both show the same market — MNQ, 5 days. The difference is what you see.
Not every active market is a readable market. OKB showed all 20 fractal levels active — not as strength, but as a sign of high complexity. DOGE with fewer active levels showed more structure.
FAIB NEXUS reveals these differences automatically — without manual settings. The structure becomes visible before it needs to be subjectively interpreted.
Bond, BTC, MNQ — three completely different markets. The same methodical principle is applicable — but the expression is different for each.
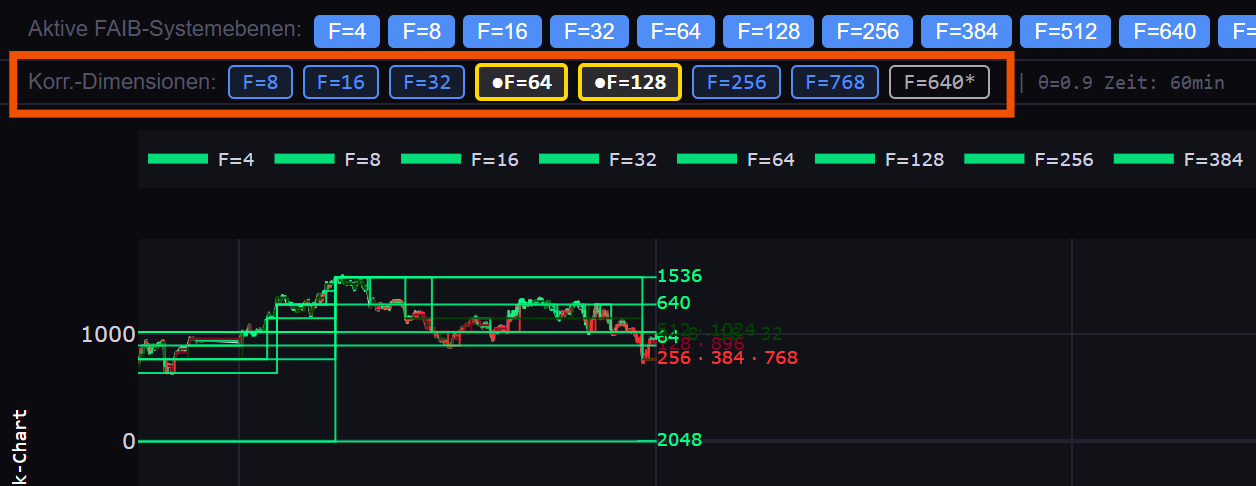
Through fractal analysis the characteristic middle zone of a market can be identified — the level where large trends begin and end, where structure shifts. This zone is not fixed. It changes — different in the morning than at midday, different today than next week.
Not a configuration. Market structure that reveals itself through analysis.
In many cases 10 days of increment data already delivers higher operational sharpness than significantly longer classical time windows. Precision and focus beat data volume.
Every market has a personality — FAIB NEXUS makes it visible through structural analysis.
Bond
Calm, hierarchical, ordered.
BTC
Aggressive, complex, many levels in conflict.
DOGE
Surprisingly structured.
The system shows not only what the market does — but how its structure behaves.
FAIB NEXUS enables three analysis modes in one system:
Live
Tick by tick in real time.
Live-Analysis
Live continues, historical period analysed simultaneously. One click — back to current signal.
Period Analysis
Focused historical period up to 3 months via datafeed.
No restart. No tool switching. Everything in one environment.
Not every fractal level is relevant for every market. Bond shows its structure already in the smallest levels — F=1, F=2, F=3 — because it is slow and precise. BTC only begins to speak from F=16 — below that is noise. OKB needs large levels from F=8192, because only there are the extreme movements visible.
Every market has its own signal range — the zone where structure begins and noise ends. This range is not found through settings, but through observation and experience.
The profile system stores exactly this knowledge — once found, always available. BTC starts with its signal window. Bond with its own. OKB with its own.
Market research that remembers.
Early Access — Research Edition
Not early access to an idea — but access to a working analysis system that is continuously developed.
The current product stage is deliberately focused on a clearly defined analysis core — to ensure stability, performance and interpretability of the data.
Available today
Coming — continuous updates
Early adopters grow with every development stage. Updates included for the duration of the active subscription.
FAIB NEXUS is an analysis and research tool. No order execution. No investment advice. All decisions lie with the user.
Supported markets
IBKR TWS — Futures (50+ instruments)
Micro Index
MNQ · MES · MYM · M2K
E-Mini Index
NQ · ES · YM · RTY
Metals
GC · MGC · SI · HG · PA · PL
Energy
CL · MCL · NG · RB · HO · BZ
Interest Rates
ZB · UB · ZN · ZF · ZT
Agriculture
ZC · ZS · ZW · KE · ZM · ZL · ZO · ZR
FX Micro
M6E · M6B · M6A
FX Futures
6E · 6B · 6A · 6J · 6C · 6S · 6N
Binance — Crypto Spot & Futures (40 instruments)
L1 / Majors
BTC · ETH · SOL · BNB · AVAX
ADA · DOT · MATIC · NEAR · ATOM
SUI · APT · SEI · XRP · LTC
Layer 2
ARB · OP · STX
DeFi
UNI · AAVE · LINK · INJ · JUP
PENDLE · ENA · CRV · MKR
AI
FET · RENDER · TIA · WLD
Meme
DOGE · SHIB · PEPE · WIF · BONK
Gaming
SAND · MANA · AXS
CEX
OKB
Expandable to further markets and data sources on request at any time.
In Practice
Try it
No installation required. Opens directly in the browser.
Demo version: CSV-based analysis — full system depth, no live feed.
The demo gives you access to the complete analytical system — all 20 fractal levels, all four forces, slaving analogy, fractal coherence and phase transition intensity. Based on historical market data via CSV.
Get in touch — you will receive the password and a brief introduction to the system. No obligation, no costs.
Request Demo Access →The philosophy behind FAIB NEXUS
Observation before signal. · Signal before interpretation. · Interpretation before decision.